







Workplace Intelligence · A SiteIQ service

See how your workplace is really used.

SiteIQ measures how desks, rooms and shared spaces are actually occupied — turning guesswork into evidence you can plan, price and invest against.

Workplace analytics report
Trusted by
Eli LillyJohnson & JohnsonJanssenMSDBoston ScientificGilead SciencesUniversity College Cork
Why it matters

Hybrid work made space invisible. Data makes it legible.

Hybrid working made demand variable and hard to see. Without real occupancy data, space decisions come down to anecdote and instinct.

The problem today
Return-to-office and hybrid demand is unpredictable
Desks feel scarce while whole zones sit empty
Canteens and car parks congest at peak times
Redesign and lease decisions rest on guesswork
Spreadsheets and tribal knowledge quietly go stale
What changes with SiteIQ
Uncover hidden capacity you already own
Right-size desks, rooms and shared space
De-risk RTO and hybrid decisions with evidence
Ease congestion and improve employee experience
Avoid unnecessary property spend
What we measure

Every shared space, from desk to car park.

We map how people move through and occupy the spaces they actually compete for.

Desk occupancy heatmap
Desks

Understand utilisation, demand and real usage patterns.

Meeting room / shared space
Rooms & shared spaces

Track meeting rooms, collaboration areas and communal spaces.

Car park
Car parks

Monitor demand, peak usage and allocation.

How it works

A point-in-time study, or always-on sensors.

Two ways to capture the data — both feeding the same dashboards, heatmaps and leadership-ready reports. We help you choose, or combine, based on your goals, budget and timeline.

Manual studies run on SiteIQ Schematic, our occupancy-study software. Engage us to deliver the study, or licence Schematic and run it with your own people.

Route 1
Manual occupancy studies

Trained surveyors capture usage at scheduled intervals on tablets. Fast and low-cost — ideal for a one-off, whole-site snapshot with no hardware to install.

Point-in-timeNo hardwareResults in ~4 weeks
Explore Route 1 →
Route 2 · with RedZone
IoT occupancy analytics

Discreet IoT sensors monitor occupancy continuously. Always-on and real-time — ideal for ongoing optimisation, live dashboards and long-term trends.

ContinuousReal-timeSensors, not cameras
Explore Route 2 →
Route 1 · Manual occupancy studies

Plan to results in four weeks.

A structured survey run by trained surveyors — no sensors, no IT integration, no delays.

01
Plan

Scope, schedule and customise your study.

02
Execute

Surveyors gather occupancy data on smart devices.

03
Analyse

We deliver insight through dashboards, heatmaps and custom reporting.

04
Optimise

We guide you through data-driven changes.

Delivery models — choose what fits your team
Self-managed

You provide surveyors. SiteIQ oversees quality and reporting.

Outsourced

FM or cleaning-service surveyors gather data; SiteIQ oversees.

Full-service

SiteIQ handles everything, delivering leadership-ready insights.

Route 2 · IoT occupancy analytics, with RedZone

Always-on sensors for continuous, real-time occupancy.

When you need live data rather than a snapshot, we deploy IoT sensor networks with our partner RedZone — continuous occupancy across desks, rooms, canteens and car parks, with no cameras and no access to your IT infrastructure.

Sensors, not cameras

Non-camera occupancy sensing can be configured to measure use without directly identifying individuals.

Standalone systems

A fully independent network — no access to client IT required.

Real-time monitoring

Visualise occupancy live and respond to congestion instantly.

Light-touch install

Discreet, battery-operated sensors (5–10 year life), deployed out of hours.

Proven ROI

Unlock hidden capacity and avoid significant capital expenditure.

Local trusted partner

RedZone — an Irish company pioneering occupancy IoT since 2017.

Measured spaces Desks Meeting rooms Canteens Car parks Events & venues
Connects to your stack Desk-booking integration Real-time occupancy screens & app Custom quarterly reporting Occupancy-linked HVAC & sustainability
What you get

From data to decisions — no spreadsheets, no guesswork.

Whichever route you choose, the data lands as insight you can act on — presented for the people making the decisions.

Custom dashboards
Heatmaps & trends
Time-based insights
Executive reports & recommendations
Workplace analytics report
Proven results

Trusted on live sites, from a single study to five-year deployments.

Route 2 · IoT · Long-term deployment

Five years on-site at a global pharmaceutical manufacturer.

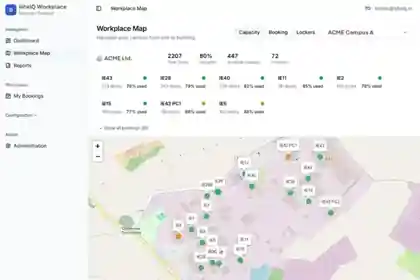
At a fast-growing Co. Cork pharma site of 2,000+ workspaces, a phased IoT rollout since 2021 has grown to 360 desk sensors plus a gym and two canteens — all in one live view, integrated with desk booking, with custom reporting for management. The result: data-driven desk reallocation, dynamic hot-desking and reduced congestion.

“The powerful data has transformed how we manage our resources, enabling a more dynamic and employee-centric approach to workspace utilisation.”— Facilities lead, global pharmaceutical manufacturer (Co. Cork)
5→6
Buildings
360
Desk sensors
40M+
Data points
100+
Reports delivered
Route 1 · Manual study

A whole-site snapshot in four weeks.

A Co. Cork multinational with 1,000+ daily employees used a manual study to reveal hidden capacity — the data backbone for a short-, medium- and long-term workplace redesign.

888
Desks
85,248
Observations
4 wks
To insight
Route 2 · IoT · Event analytics

Turning event footfall into revenue.

Over a five-day exhibition, IoT sensors across three halls and 20 doors exposed traffic anchors and dead zones — a foundation for footfall-based pricing, layout and staffing.

20M+
Data points
3
Halls
20
Doors
Route 2 · IoT · Monthly reporting

Finding the desks nobody uses.

Desk-level sensors across a large pharmaceutical manufacturing campus produce monthly utilisation reporting by area. 

763
Desks
13
Areas
12
Buildings

Make better workplace decisions.

Book a consultation and we will recommend the right approach for your site — a one-off study, always-on sensors, or a combination.